Gone are the days of TV guides and appointment television. The latest generation of TV watchers has ushered in a new age of viewership – not only in terms of what they view but how they view and consume TV content. From countless streaming platforms like Netflix or Hulu to multiple device options like Roku or Apple TV, the combination of ways to watch is virtually endless.
But, as with any innovation, disruption, or shift in a traditional landscape, this never-before-seen crop of TV watchers is creating challenges for brands of all types across the TV landscape. This includes TV service providers, technology innovators, and traditional TV advertisers.
In order to maintain a connection with consumers, no matter where and how they get their TV content, marketers and data scientists must get to know the modern TV watcher on a deeper level. Using quality data to do so is crucial to getting a better understanding of this new picture.
Who are these modern TV watchers? Are they all that different from a traditional cable subscriber?
We thought you’d never ask – let’s dive into the data!

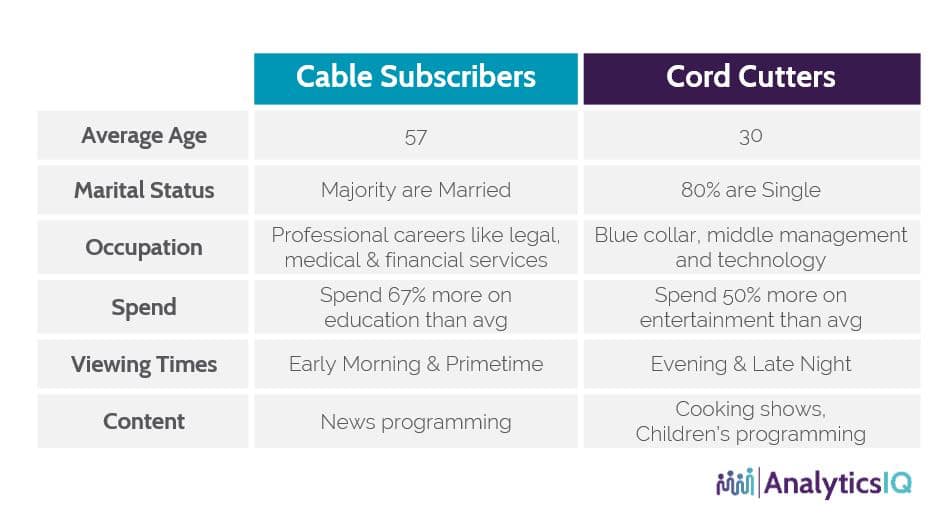
According to our team’s proprietary research on TV viewership, the average age of those most likely to subscribe to streaming services or use TV adaptors is around 30 years old – a good bit younger than the 57-year-old cable subscriber.
Unsurprisingly, cord-cutters are nearly 50% more likely to be early adopters of technology, as opposed to their lagging counterparts. The majority of cable subscribers are married, and the opposite is true for the digital TV consumer – nearly 80% of those likely to use streaming services or TV adaptors are single.
In terms of occupation, cord cutters are most likely to be employed in blue-collar, middle management, professional tech, or student positions. Cable subscribers are most likely to be employed as legal professionals, physicians, or in financial services. However, their employment doesn’t seem to affect spending levels as both groups spend more on discretionary items per year than the average population.
More specifically, streamers and cord-cutters spend nearly 50% more on entertainment per year, making them prime targets for exclusive releases. Cable subscribers spend 67% more on education – most likely attributed to college or private school expenses for their teenage children.
What about their actual TV viewership preferences?
You can catch cord cutters consuming content most often from 4 pm to 7 pm and between 11 pm to 2 am. But cable subscribers are more likely to watch from 5 am to 9 am and between 7 pm to 11 pm. Cord cutters won’t be watching the news, unlike most cable subscribers. Instead, you will find them watching cooking shows or something with their young children.
As far as device preferences, it should be no surprise that cord-cutters are approximately 50-60% more likely to watch television on a device other than a television like a smartphone, tablet, or computer.
And there is more where that came from. With over 1,200+ accurate data points on over 242M+ individuals in the United States, AnalyticsIQ can help you understand who people are, what they do, and – most importantly – why they do so. Get in touch with us today to get a comprehensive understanding of the new content consumers’ scene.
So, what does all of this mean for marketers and analytics teams?
Reliable predictive data helps brands go beyond the screen and into the hearts and minds of the TV consumer trends making waves nowadays. Data can also ensure their messaging reaches the target by choosing the proper communication channels – despite how challenging that can be, considering all the options available to consumers.

